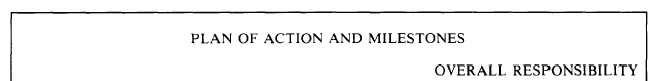
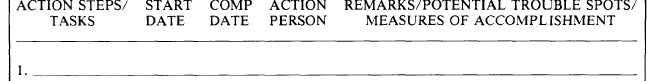
Figure 3-3.-Sample Plan of Action and Milestones (POA&M).
at specified times (see figure 3-3 for a sample
The side of the chart indicates work output,
POA&M). The POA&M is commonly used in
and the top of the chart is divided into units of
commands throughout the Navy.
Gantt Chart. —The Gantt chart shows planned
and accomplished work in relation to each other
and in relation to time. The Navy uses it as the
basis for more complicated charts, such as PERT
and CPM. You will find the Gantt chart
particularly useful in planning and controlling
operational-level tasks.
time. Refer to figure 3-4. The left side of the chart
lists tasks to be completed. The top of the chart
shows the time allotted for task completion. The
unshaded bars represent the time allowed for each
individual task. The solid bar represents how
much of each task has been completed.
Program Evaluation and Review Technique. —
The Navy developed the program evaluation and
3-8